(1) 观察数列的前项的变化趋势,并绘出其散点图;
【重复实验】
实验代码:
a:makelist(k,k,1,100,2)$
X:makelist(k^(1/k), k, 1, 100,2)$
wxplot2d([discrete,a,X],[style,[points,1,5,1]]);
wxdraw2d(grid=true,point_type = 7,
point_size = 1,color =red,points(a,X));
f(x):=x^(1/x);
kk:[500,1000,5000,10000,100000];
M:map('f,kk),numer;
M-1.0;
执行结果:
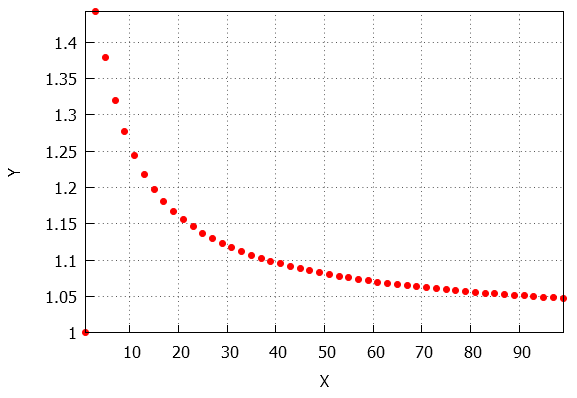
[1.012506779923466,
1.006931668851804,
1.001704890314044,
1.000921458319296,
1.000115135882277]